Reporting vs Analytics

This guide provides definitions and examples to help you understand the key differences and make use of these essential components of business intelligence.

Key Differences Between Reporting and Analytics

Reporting is the process of gathering and presenting data in a structured format such as graphs and tables. Organizing information in predefined KPIs and metrics makes it easier for you to understand what is happening. Analytics is the process of analyzing your data to identify patterns and gain insights. Using techniques such as predictive and prescriptive analytics helps you understand why things are happening and what to do next.

What is Reporting?

Benefits

Reporting Process

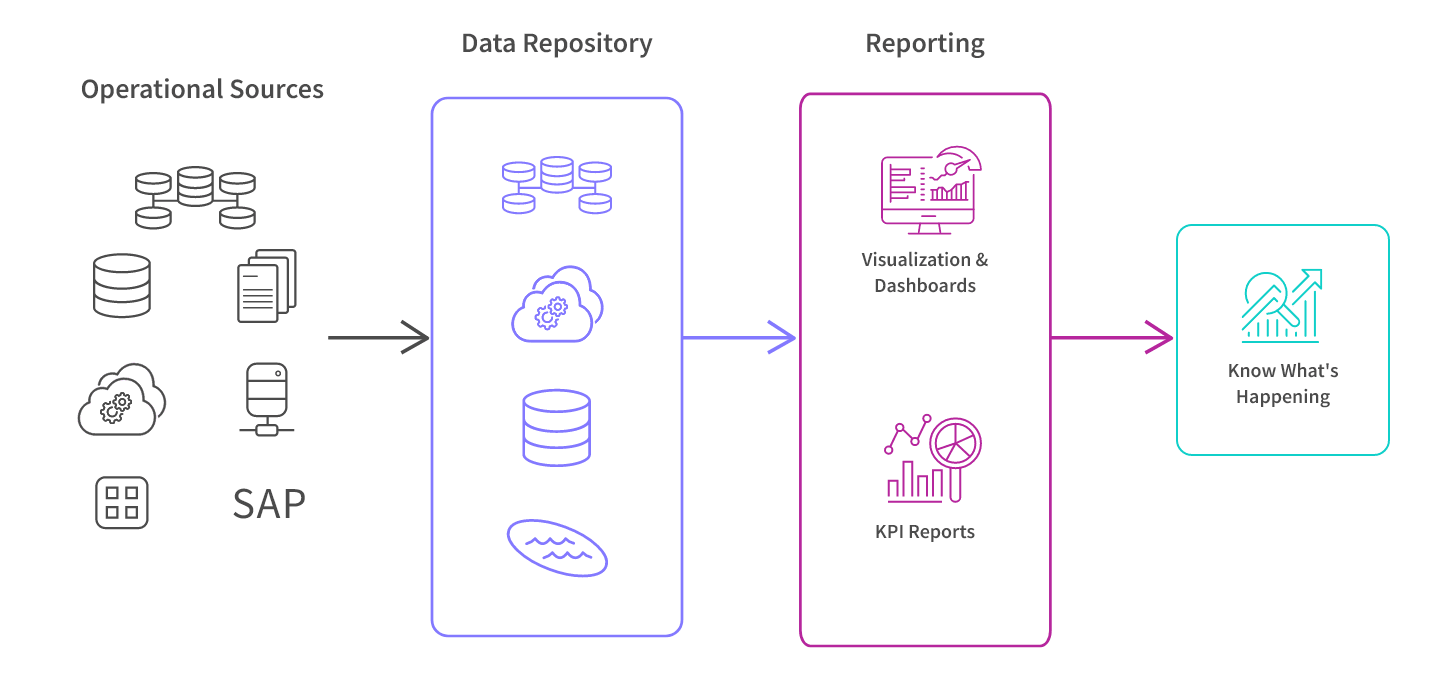
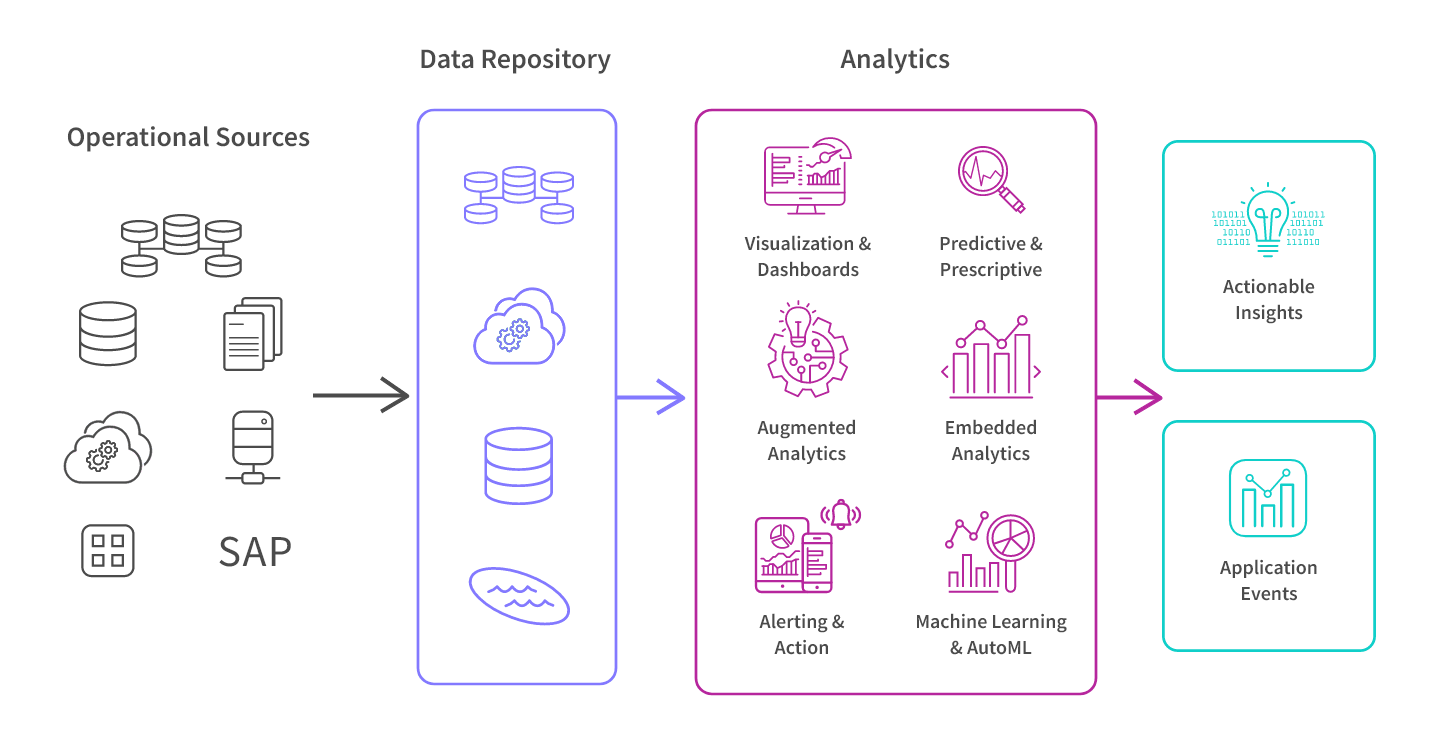
Data is sourced from operational systems such as transactional, supply chain, and CRM applications. This raw data is extracted, transformed, and combined into a repository such as a data warehouse or data lake. Bringing together data from all your systems gives you a holistic view of your business.

Your reporting analytics tool uses this data to allow you to create visualizations, dashboards and KPI reports via automation. These make it easier for you to know what has happened or what is happening in your business.

Types of Reporting

Dashboard Report Example

This marketing dashboard report showcases the number of responders to a campaign by region, segment, and product category. This dashboard presents data in an easy-to-digest manner.

Don’t just measure. Measure what matters.

Download the KPI Planning Guide to learn:

  • 10 steps to strong KPIs

  • Which questions help you define your KPIs

  • 170 KPI examples and templates

What is Analytics?

Analytics goes beyond summarizing data. Its primary purpose is to uncover meaningful insights and patterns within the data. Analytics aims to answer questions like ‘why’, ‘how’, and ‘what next’, by offering a deeper understanding of the underlying factors driving performance.

The 4 Types of Data Analytics

Question Answered

Descriptive

What happened?

Diagnostic

Why did it happen?

Predictive

What will happen?

Prescriptive

What should we do?

Predictive analytics leverages historical and current data to make informed forecasts. Prescriptive analytics takes it a step further by recommending your optimal course of action moving forward. Real-time analytics tools enable you to make business decisions based on the most current data available.

Benefits

Analytics Process

As with reporting, data is sourced from operational systems and then moved into a repository. Your analytics reporting tool uses this data to allow you to perform a variety of analysis, identify patterns and develop insights by creating interactive visualizations and dashboards. Some tools go further by enabling you to perform predictive and prescriptive analytics, augmented (AI analytics), automated machine learning, embed your analytics into other applications, and trigger alerts and actions in other systems.

Analytical Report Example

Explore an Analytical Dashboard

A workforce diversity KPI report shows demographic data to optimize for inclusion.

This dashboard allows you to measure and analyze your workforce diversity, breaking out ethnicity data by country and by salary. Modern, interactive dashboards allow you to dig deep into the analytics report data and analyze each variable.

Modern Analytics Demo Video

Modern Analytics Demo Videos

See how to explore information and quickly gain insights.

  • Combine data from all your sources

  • Dig into KPI visualizations and dashboards

  • Get AI-generated insights

Reporting and Analytics Comparison Matrix

Reporting and analytics are both integral components of a comprehensive data strategy, complementing each other to drive informed actions and improvements. Interactive dashboards bridge the gap by providing a platform for presenting both summarized reports and real-time analytics.

Reporting

Analytics

Purpose

Summarize and present data for informational purposes.

Unearth insights and patterns for strategic decision-making.

Benefits

In addition, analytics helps you understand why things are happening and know what to do next.

Users

Primarily operational managers and executives.

Primarily data analysts, data scientists, and executives.

Data Presentation

Focus on simplicity and clarity, using visual aids to convey information efficiently.

In addition, analytics may employ advanced statistical methods and models for more in-depth analysis.

Data Source & Type

Typically relies on structured data from established sources.

May encompass a broader range including unstructured, big data, and real-time data.

Process

Data collection, organization, and presentation.

Data collection, organization, and presentation. Plus, data exploration, hypothesis testing, and advanced analysis.

Tool Complexity

Reporting tools are usually user-friendly and straightforward, making them accessible to a wide range of users without extensive technical training.

Self-service analytics tools are user-friendly but advanced analysis and predictive modeling can require a higher level of technical expertise.

The combination of both reporting and analytics ensures a comprehensive approach to data utilization.

10 Ways to Take Your Visualizations to the Next Level

Inspire action with your data. Learn about the latest visualizations and how to choose the right ones to highlight the most important aspects of your data.

FAQs

Why is reporting analytics important?

Reporting analytics is crucial for organizations to make informed decisions based on data. It provides a clear and concise summary of key performance indicators, allowing stakeholders to track progress and identify areas for improvement. Additionally, reporting analytics enables businesses to communicate their performance effectively, facilitating transparency and accountability.

What are the 3 main types of analytical reports?

The three main types of analytical reports are:

What is data reporting vs data analytics?

What is the difference between reporting and data analyst?

A reporting role primarily involves creating and presenting reports based on predefined metrics or key performance indicators. It emphasizes the presentation of data in a clear and concise manner. A data analyst, on the other hand, is responsible for conducting more in-depth analysis of data. This includes tasks like data exploration, hypothesis testing, and applying statistical techniques to extract meaningful insights. Data analysts often work with complex data sets and use various analytical tools to derive insights for decision-making.

See modern analytics in action