


QLIK COMPOSE® FOR DATA LAKES
Data Lake Automation Software for Faster Delivery

Automate analytics ready data pipelines
Create analytics-ready data sets by automating data ingestion, schema creation, and continual updates.

KEY RESOURCE
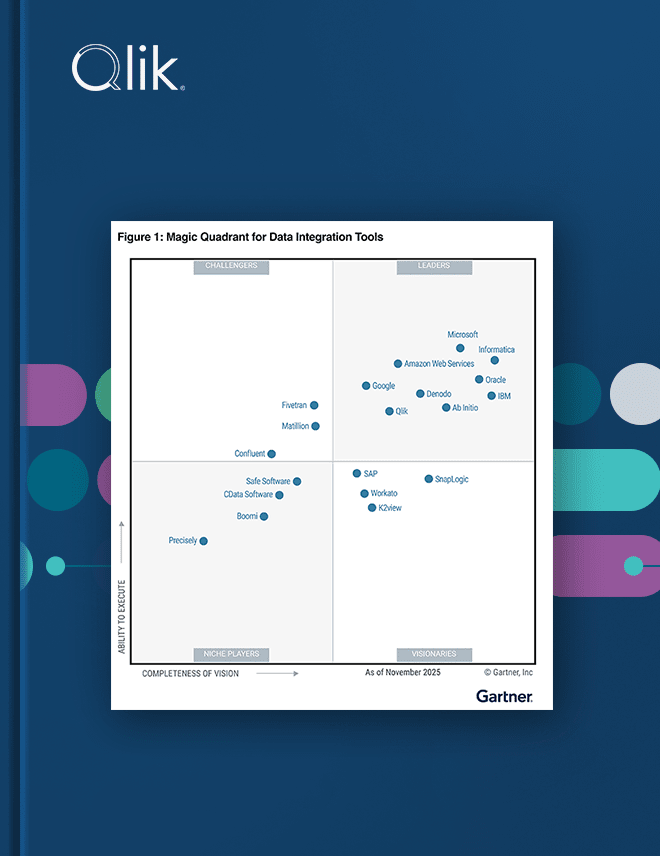
2025 Gartner® Magic Quadrant™ for Data Integration Tools
For the 10th consecutive year, Qlik was recognized as a Leader in the 2025 Gartner® Magic Quadrant™ for Data Integration Tools. Learn why in this complimentary report.

Easy data structuring and transformation
Build, model and execute data lake pipelines with an intuitive guided user interface
Automatically generate schemas and Hive Catalog structures for operational data stores (ODS) and historical data stores (HDS) without manual coding

Get continuous updates
Be confident that your ODS and HDS accurately represent your source systems
Use change data capture (CDC) to enable real-time analytics with less administrative and processing overhead
Efficiently process initial loading with parallel threading
Ensure only transactions completed within a specified time are processed, using time based partitioning and transactional consistency

Generate cost effective low latency views of live data
Merge the latest unprocessed changes in the change table (including the last open partition), on Read.
Optimize compute by creating live views, both ODS and HDS, without processing changes every time

Generate analytics specific data sets from a full historical data store (HDS)
Automatically append new rows to HDS as data updates arrive from source systems
Automatically time-stamp new HDS records, to create trend analysis and other time oriented analytic data marts
Support data models that include Type-2, slowing changing dimensions

How Qlik Compose for Data Lakes works
Get real time, analytics-ready, and actionable data to an analytics environment, from Qlik to Tableau, Power BI and beyond.