Qlik Cloud Analytics
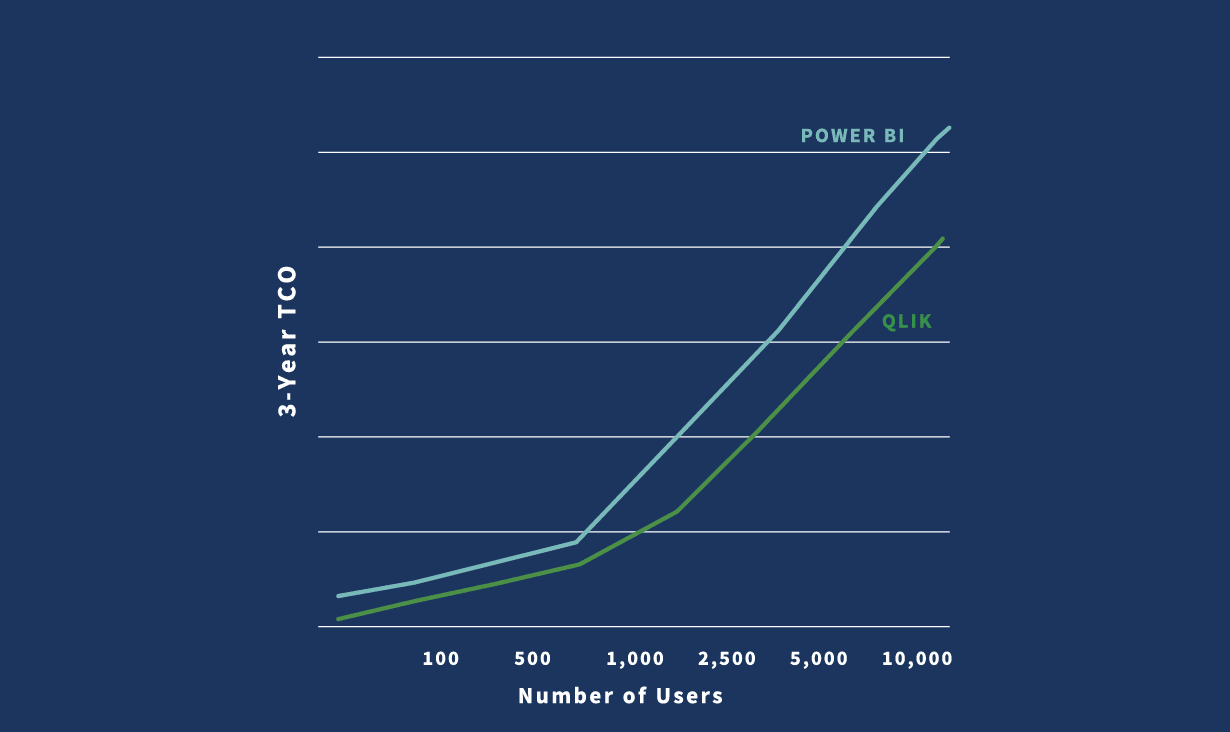
Qlik has transparent predictable, capacity-based pricing. Plus, all features — like alerting, reporting, automations, and AutoML — are included with Qlik Cloud Analytics.
Power BI
Power BI may seem low-cost on the surface. But as you add more users or need to do more complex analysis, Power BI becomes more expensive and more unpredictable compared to Qlik. Power BI at scale isn’t just Power BI, it’s Fabric and a lot of added-on features that can quickly consume capacity.
“The price comparison is very misleading.”
- Tomasz Wojcik, Thermoplast*
Qlik Cloud Analytics
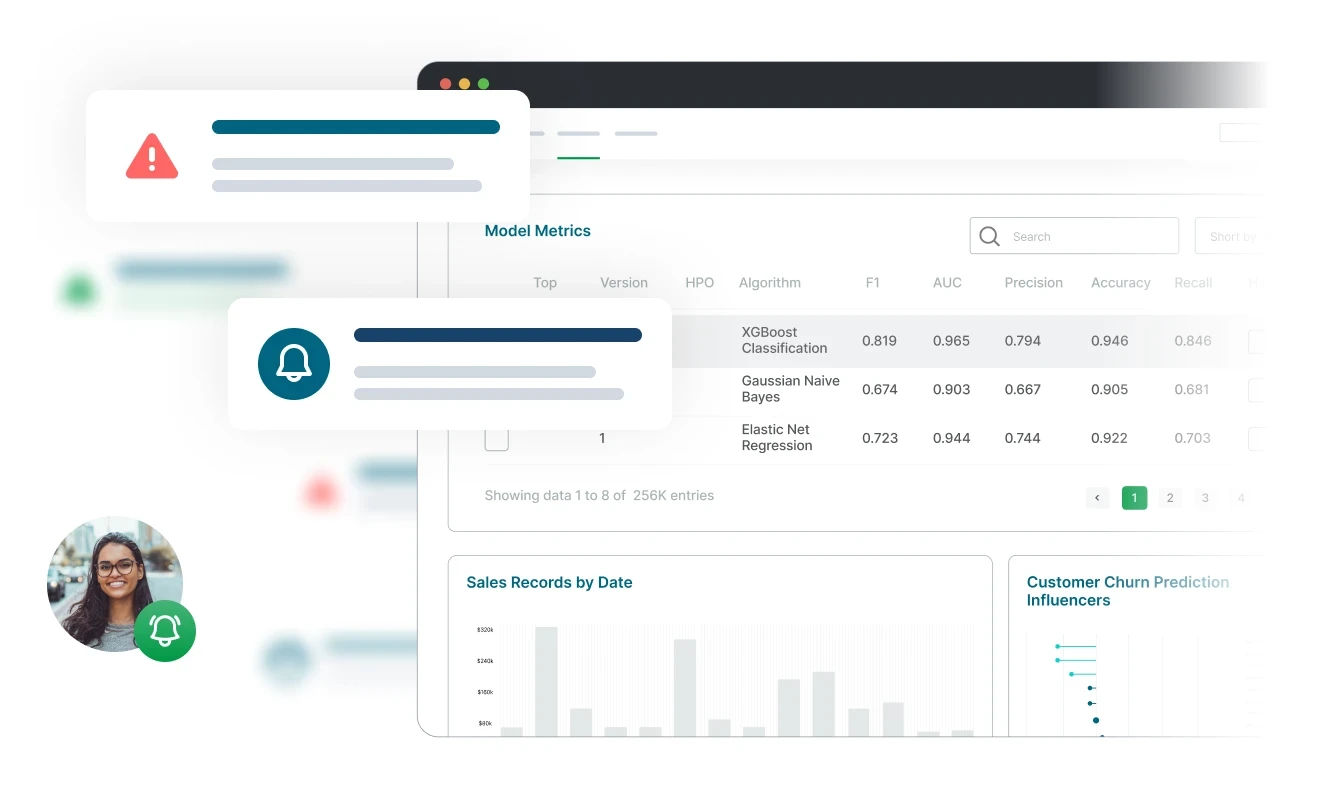
With AI and ML integrated into its platform at a foundational level, Qlik supports a full range of augmented analytics capabilities. Insight Advisor is an intelligent AI assistant that supports automated insight generation, natural language analytics, and AI assistance. Together, these capabilities offer deeper insight, help more users become data literate, and speed time to value.
Power BI
Simple AI use cases – can be accessed with Power BI. When complexity grows, it will require other products – Copilot Studio or Azure ML. Copilot provides a chat bot experience and authoring assistant while Quick Insights and Q&A support natural language capabilities.
“Conversational analytics in Qlik Sense allows us to give the intelligence that people in the field need right where and when they need it.”
- Pavan Arora*
Qlik Cloud Analytics
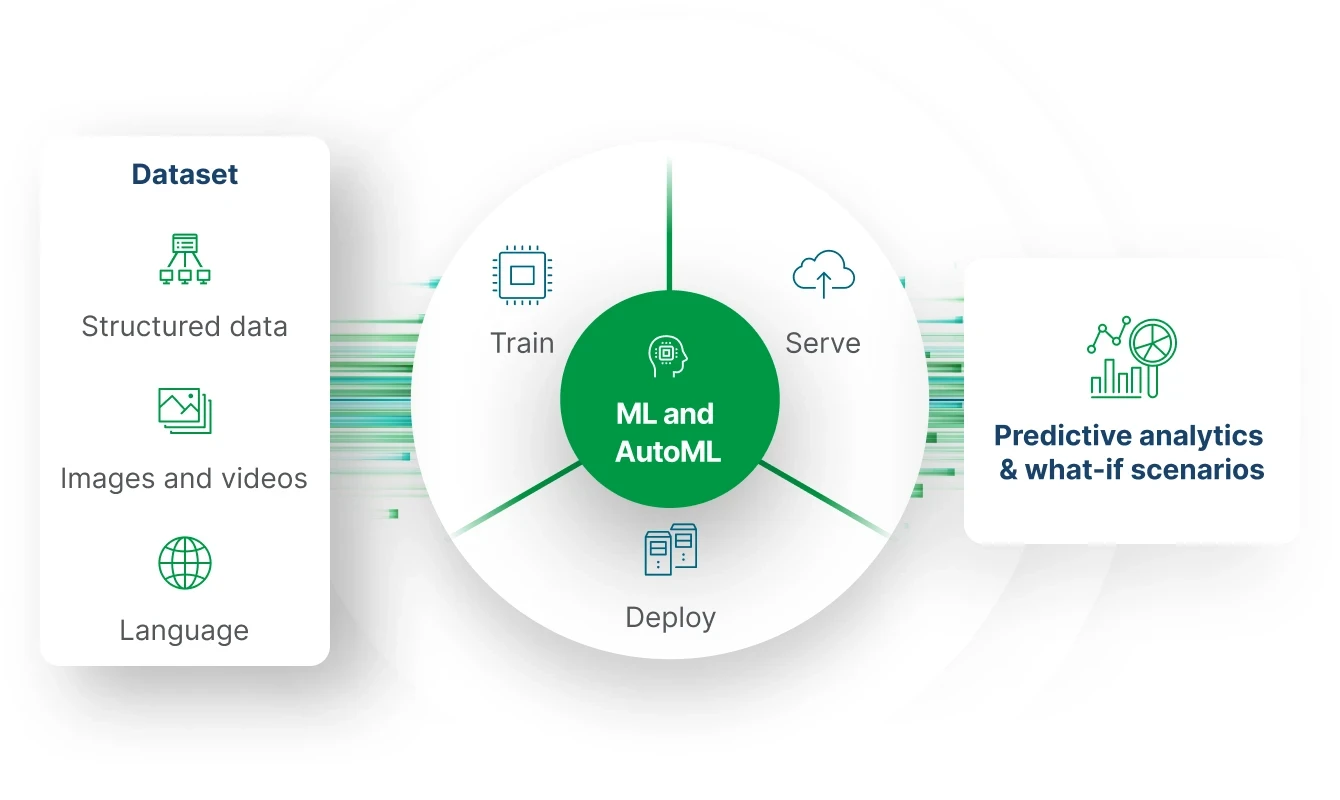
Qlik AutoML® allows business users to easily create ML models and generate predictive analytics, helping you move from historical analysis to next-level predictive and prescriptive analytics. With full explainability, you can understand not just what might happen, but why — so you can take action. Qlik also works well with your existing data science tools, using a full suite of real-time, pre-built connectors.
Power BI
In Power BI, AutoML capabilities sufficient to match Qlik's built in ML/Predictive abilities can only be accessed through Premium with costly Fabric credit usage. In addition. Power BI doesn’t have nearly as many connectors as Qlik. Keeping it to business as usual, Microsoft works well only if you have their whole stack.
“We were stumbling blind trying to figure out what would stop churn, and it was frustrating trying to find something that would move the needle. Now, machine learning has really given us direct clarity as to what will make a difference. Instead of guessing, we now know what will bring results. ”
- Ben Dean*
Qlik Cloud Analytics
Users of all skill levels across your business can engage in the best way for them, from data exploration to real-time analytics and natural language interaction, on the same platform with a common analytics data pipeline, analytics engine, and AI capabilities.
Power BI
Power BI at its core is focused on more basic use cases (“Excel on steroids” is a common descriptor), not the full capabilities of a modern BI tool. Investing in Fabric and other tools like Power Automate would be necessary to compete with Qlik’s offering.
“Not only has Qlik's partnership brought us where we are today, but it's been used for dozens of different use cases around our organization. ”
- Jason Ferriggi*
Qlik Cloud Analytics
Qlik offers intelligent, fully data-driven alerting that is independent of any particular visualizations — delivered through email and mobile push notifications. With application automation, you can easily orchestrate worry-free events and actions in all kinds of downstream systems and workflows.
Power BI
Power BI does support basic alerting in its standard offering but limits you to a subscription based on a single KPI. To match Qlik’s capabilities, you’ll need to buy Power Automate, a separate product that is not simple for business users to configure.
“We believe the combination of self-alerting and mobility is responsible for the continual growth in our user base.”
- Rob O'Neill*
Qlik Cloud Analytics
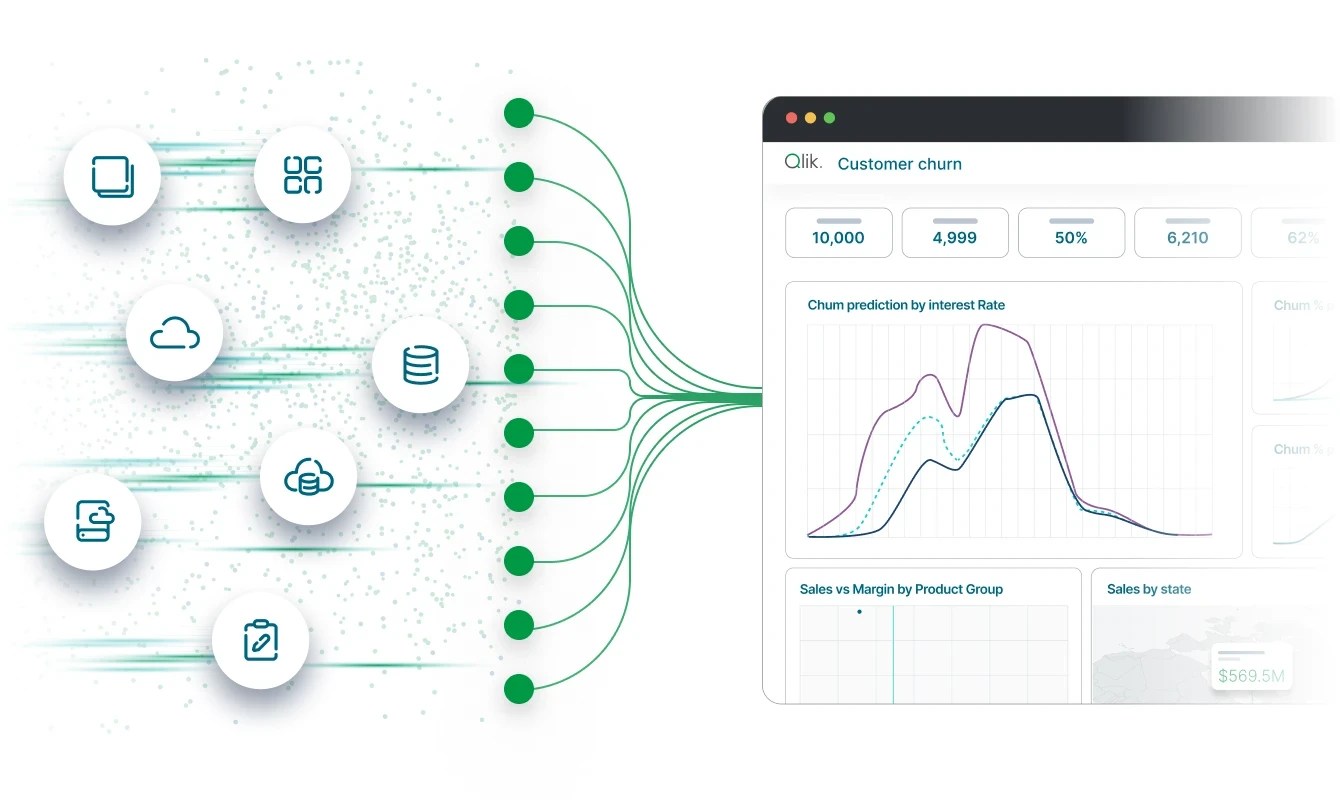
Qlik centralizes and unifies your data and analytics in the cloud, creating governed data models with robust data security. Because all content creation happens in the cloud, it’s governed and controlled at every step. After their initial creation, these governed libraries provide reuse and standardization for analytics.
Power BI
Power BI takes a decentralized approach, spreading data across people’s desktops and the cloud. End users don’t have the ability to create their own viz or make changes to existing ones; they are always dependent on the authors. This makes managing data expensive, disjointed, and time-consuming.
“Not everyone is a data geek. Creating a simple-to-use application gives everyone—regardless of their comfort with data—the tools they need to better perform their job.”
- Michael Taylor*
Qlik Cloud Analytics
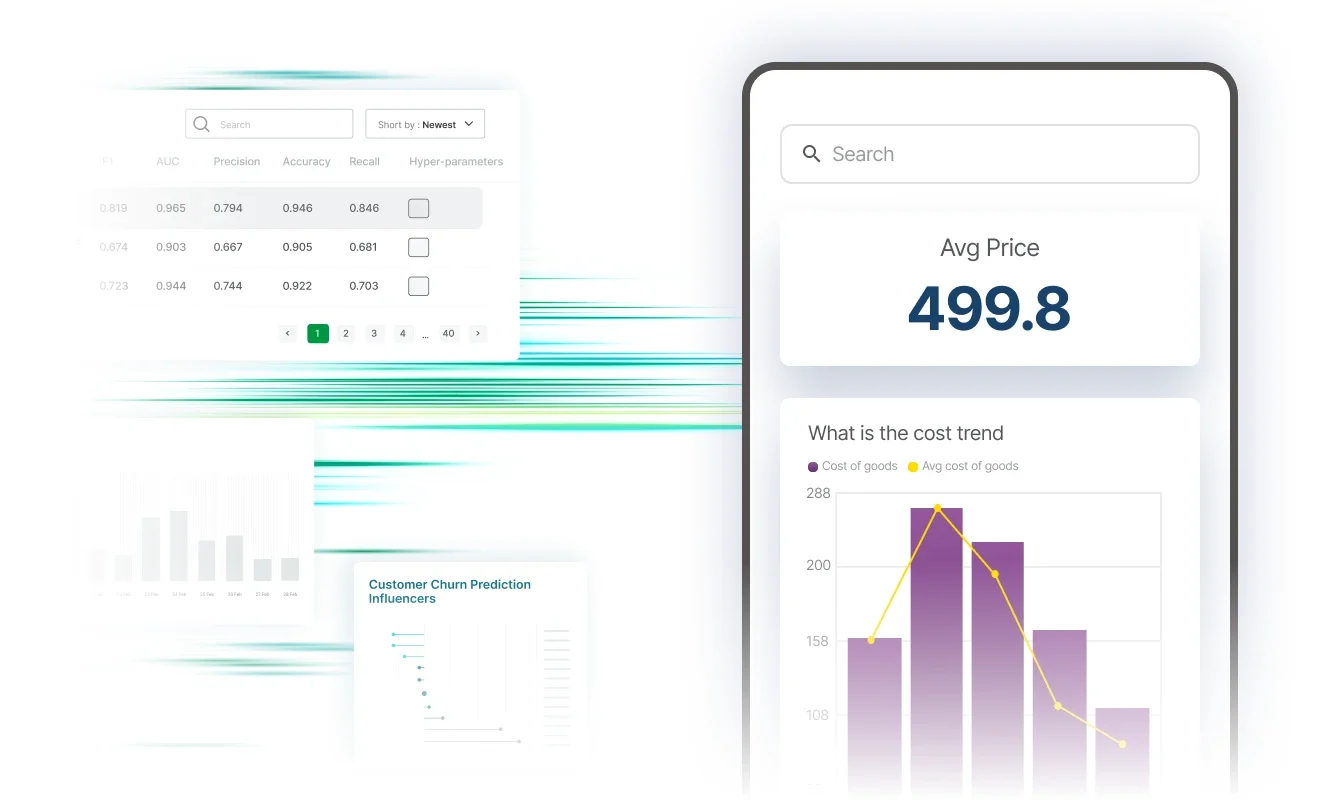
Qlik offers a fully native mobile app — its analytics engine runs locally and alerts are pushed. With responsive design and touch interaction native to the Qlik platform, you get fully interactive online and offline exploration plus integrated alerting without having to redesign apps for mobile access.
Power BI
Power BI has a view-only mobile app with limited alerting. Because they aren’t responsive, reports must have an attached, mobile-optimized layout for best results.
Qlik Cloud Analytics
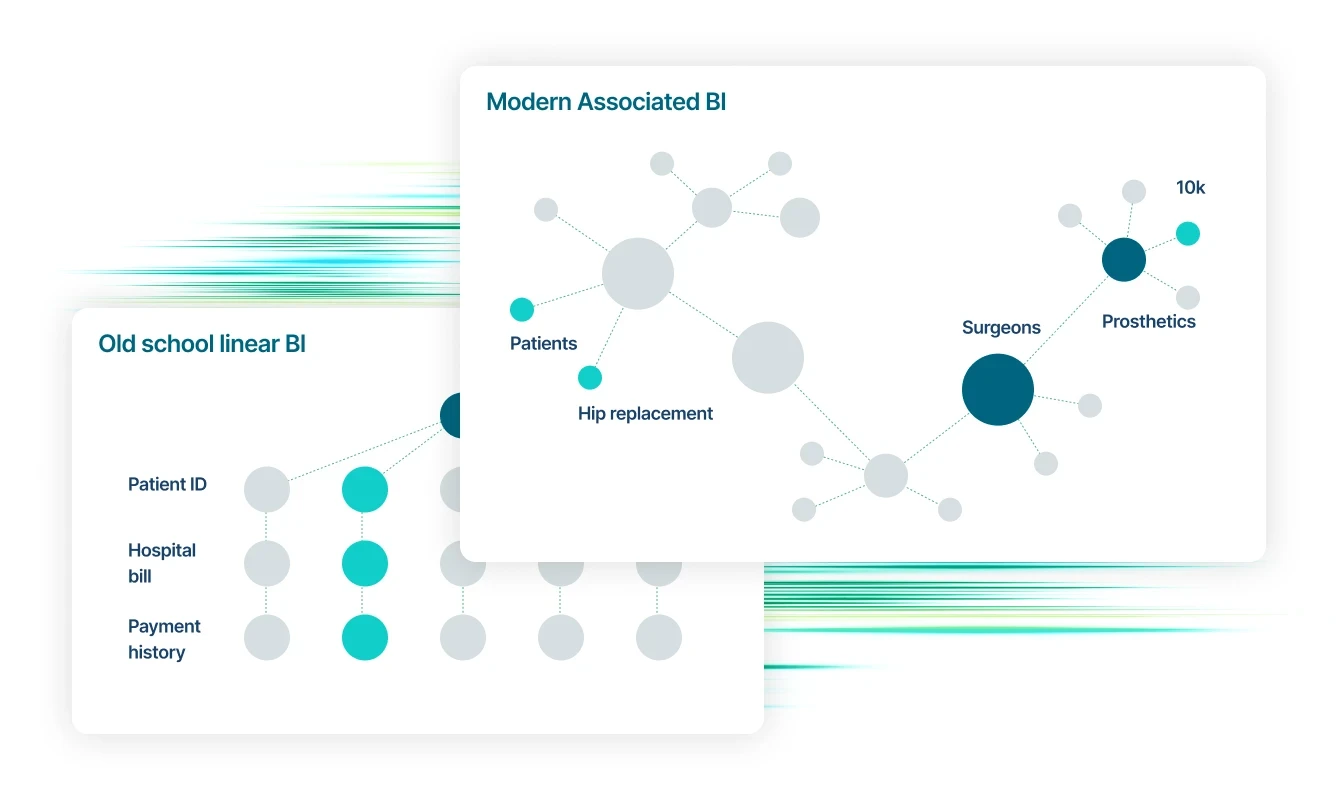
Qlik’s associative engine provides instant calculation performance even with massive datasets, real-time data unanticipated questions, and high numbers of users. With Qlik's robust incremental update and partial reload features, you can keep data fresher in a much smaller build window. Learn more.
BONUS: On Qlik, whether 1 or 50,000, the same software is used to deploy any use case.
“Near the beginning of our journey with the analytics platform Qlik, we had about 2,000 users. However, as word spread, the number of interested staff grew exponentially. Roughly a year later, in 2020, we had nearly 20,000 users on the platform. As of the first quarter of 2021, more than 35,000 people were engaged. ”
- Axel Goris*
Qlik Cloud Analytics
Qlik’s platform was built API-first using modern standards. This means you can embed a dashboard — and individual numbers, values, and metrics — within the latest web and application technologies.
Power BI
While Power BI does make it possible to embed dashboards and objects within other apps, Power BI is not API-first. Many capabilities are not available in its SDKs, the more relevant being the lack of self-service.
“Qlik’s complete set of open APIs enables us to fully customize analytics solutions, rapidly develop new custom apps, visualizations, and extensions, and embed fully interactive analytics within the applications people use every day. ”
- Aaron Growitz*
Qlik Cloud Analytics
Qlik’s associative engine is the key to combining many different types of data from many different sources, at scale, without the limitations of SQL-joins. With both graphical data transformation and powerful scripting, you can easily deal with even the most complex of data preparation challenges.
Power BI
Making data integration work in Power BI requires you to purchase additional products from the Microsoft stack. You can have good performance with One Lake (part of Microsoft Fabric) but now you’re required to pay additional capacity and storage fees for One Lake. Even then, it can still be difficult to manage the disparate offerings, not to mention additional platforms for data prep.
“Databases can be huge, with information coming from multiple sources. Qlik’s associative selection model and powerful data engine make it simple to turn piles of data into wisdom.”
- Sandra Norman Andersen*
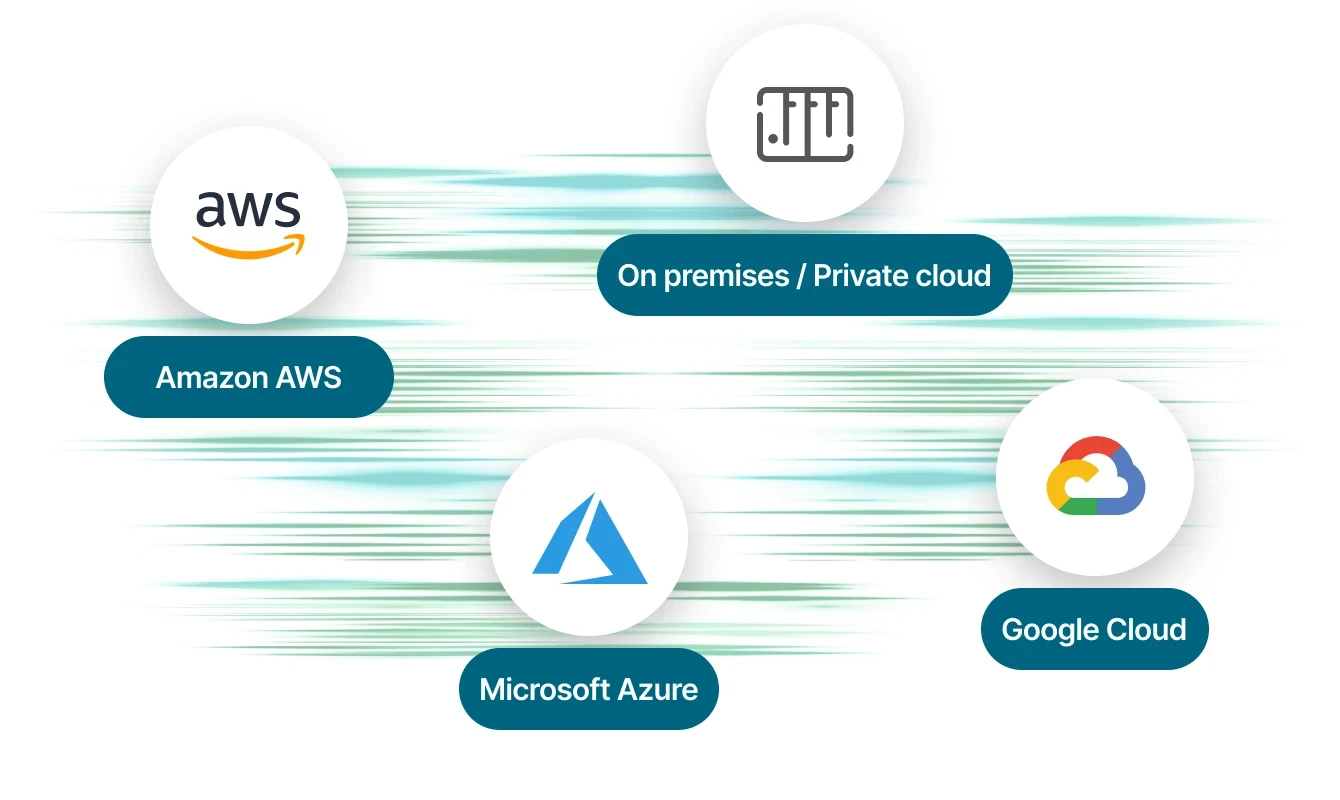
Qlik Cloud Analytics
As an independent platform, Qlik offers you total freedom and control for your data, whether it resides in one or more cloud environments or on premises. Qlik provides a full enterprise SaaS environment and on-premises or private cloud deployment options Learn about Qlik Cloud.
Power BI
With Power BI, you’re locked into Azure, and popular vendors like Google and AWS are simply not in the cards. There’s no hybrid option, and if you want to host on premises, you’ll have to use a very limited version of Power BI.
Qlik Cloud Analytics
Qlik makes it easy for anyone, at any skill level, to explore their data. Even better, Qlik offers data literacy training programs for any user. Users are able to make copies of projects, experiment and explore on their own for a truly collaborative experience.
Power BI
Power BI only provides self-service access to authors. Once those authors have published content, it’s only available with very limited interactivity. All other users must go back to the author for a new report when they want to explore deeper.
“We use features like Qlik Continuous Classroom to help people to develop data literacy.”
- Vladimir Baklanov*
*Qlik User Survey