


MANUFACTURING
Use Data to Optimize Processes, Improve Supply Chain Agility, and Better Serve Your Customers
Transform your business towards industry 4.0 and a data driven-approach with Qlik® for manufacturing organizations.


Explore manufacturing solutions
Digitalization creates a step change opportunity for operational improvement and innovation
Industry 4.0 and IoT deliver the machine and product performance that you need and the data trail to improve manufacturing operations. Qlik ensures faster time-to-value and streamlined processes by surfacing highly accurate and groundbreaking real-time data and insights across the entire product lifecycle.
Data Integration and Analytics
Meet the challenges of many markets
Extract SAP data with Qlik Data Integration, then analyze it with Qlik Sense®. You can tell the whole story through data.

Analytics for Manufacturing
Improve production throughput
Analyze Overall Equipment Efficiency (OEE) easily to understand uptime at each production site and improve throughput. Qlik associative technology brings together all key machine level data, such as availability, performance, and quality. So you can determine which factors are improving or worsening and which have the greatest operational impact.

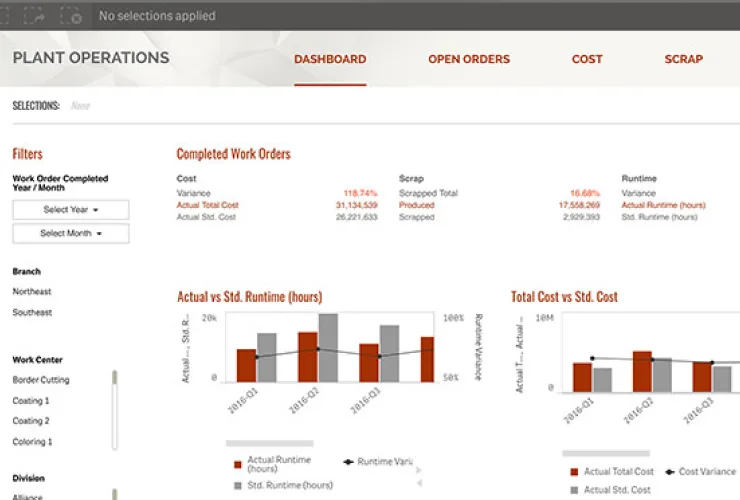
Better understand plant operations

Leverage IoT data to continuously innovate


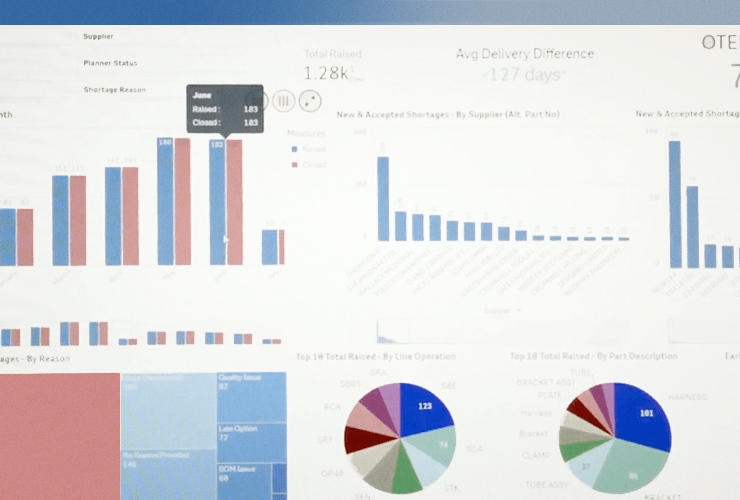
Make sense of complex manufacturing data

Understand quality issues in context
Data Integration for Manufacturing
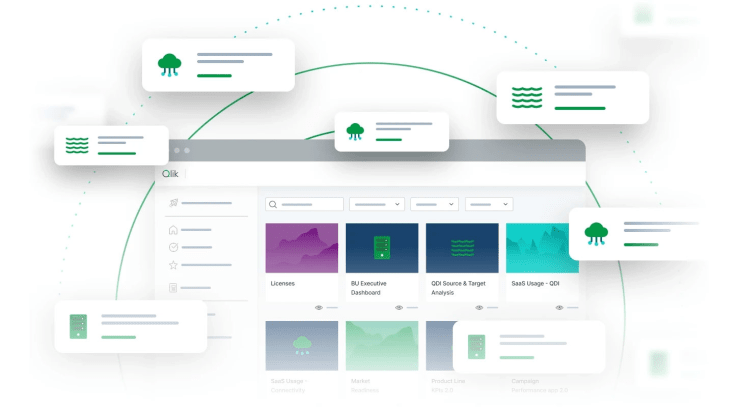
Streamline data for improved decision-making
Extract and standardize large volumes of data from various manufacturing systems (MES, IoT, QMS, HMI, etc.) throughout your organization. Qlik offers one of the broadest ranges of connectivity in the industry, granting your business units access to consistent, trusted, and quality data.
Utilize real-time data to increase operational efficiency

Accelerate access to data

Supply Chain Visibility (SCV) is core to managing complex enterprise ecosystems
You can overcome supply chain complexity to ensure multi-channel, demand driven inventory availability and pursue after market opportunity. That means harnessing data from disparate, internal and external data sources. With Qlik Data Integration, you can connect directly to ERP, SCM, Forecasting, MES, and other internal systems. And, external data sources like third-party logistics and consumer demand/sentiment, all with no data warehouse required. Your decision making will be informed by comprehensive and sound data. You’ll also surface potential supply chain issues.

Take control of your supply chain to better serve customers

Transform disparate data into a profitable growth driver
When it comes to modern innovation, consistent customer engagement is the key
Sense and respond to shifts in demand in real-time
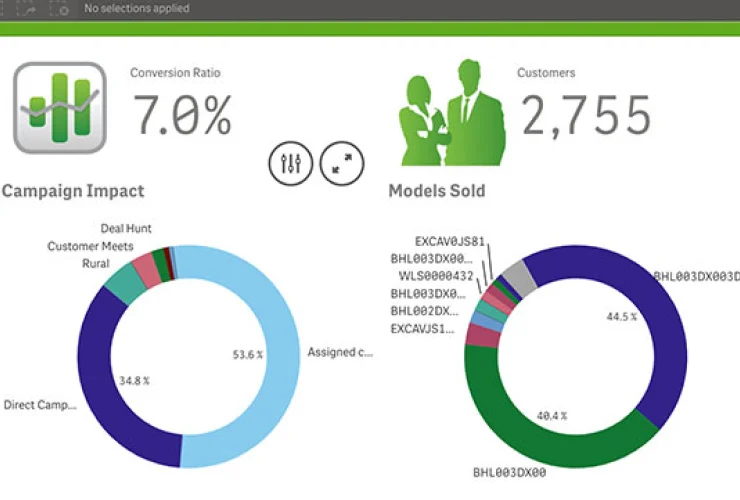
Understand automotive dealer performance
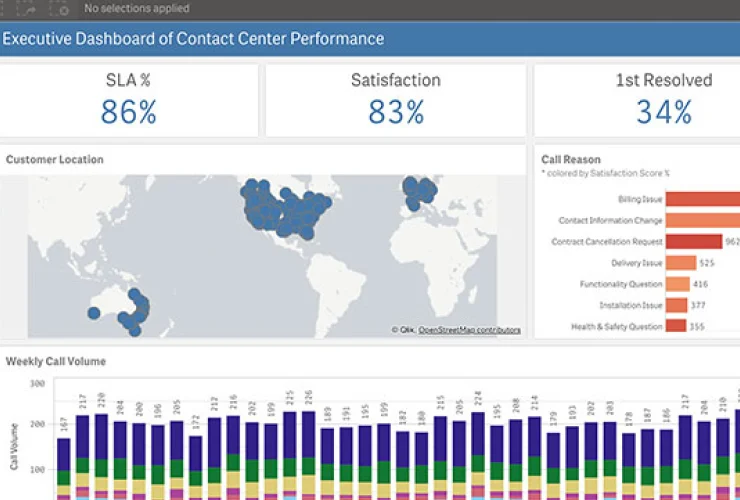
Measure customer service and call center effectiveness
Over 5000 manufacturing customers rely on Qlik for data-driven insights and real-time data across the extended supply chain
We use Qlik in every functional area of our company. It drives product improvement, which increases customer satisfaction and ultimately that brings cost benefits to the business.