


SALES ANALYTICS
Drive Productivity, Grow Revenue, and Reduce Risk
Best-in-class sales analytics enable organizations to gain insight more effectively.


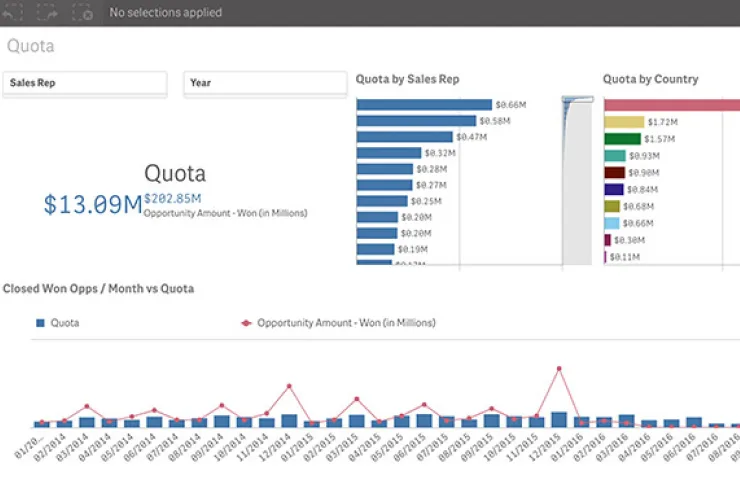
Plan confidently with data driven forecasting and pipeline management
Two of the leading causes of forecast inaccuracies and missed targets are insufficient pipeline data and the limited analytical capabilities CRM platforms offer. Qlik® helps sales and RevOps teams analyze current and historical data to identify relevant trends and behavior patterns, and build more accuracy into quota analysis, benchmarks, and forecasting.
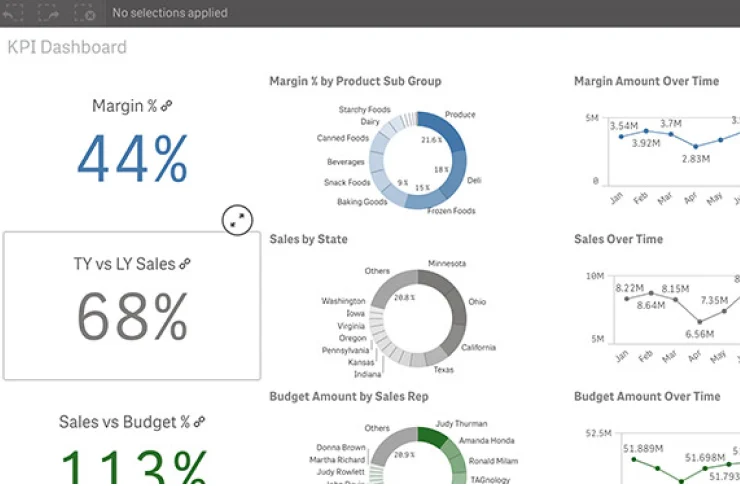
Forecast more accurately with a clear view of the entire sales cycle
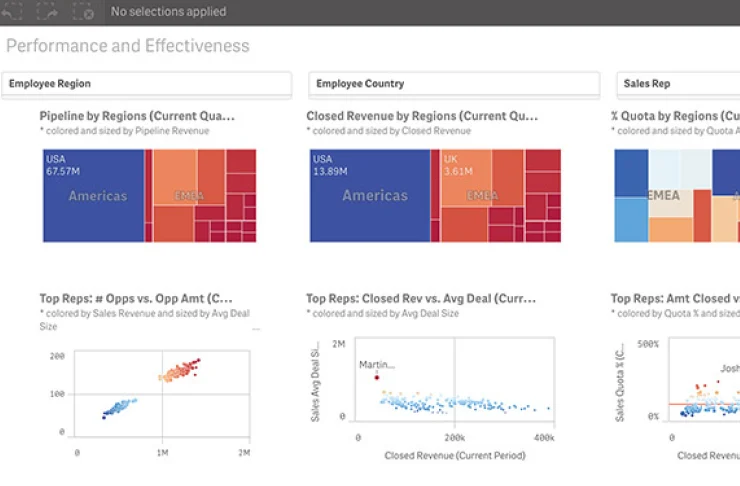
Meet and exceed sales goals with better performance analysis
Reveal hidden insight by bringing your sales data together
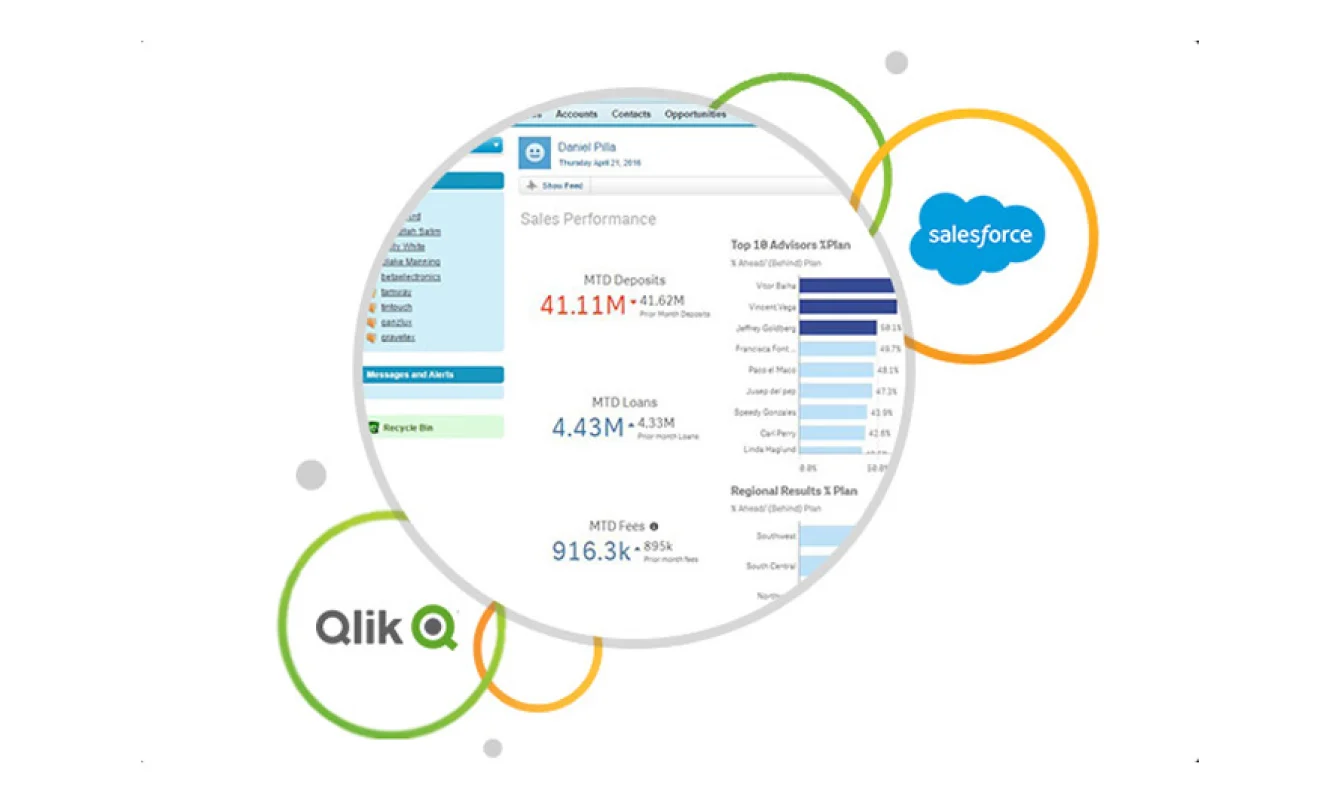
Transform your Salesforce data into actionable sales insight
Get powerful interactive analytics, reports, and dashboards embedded on Salesforce tabs or within Qlik apps
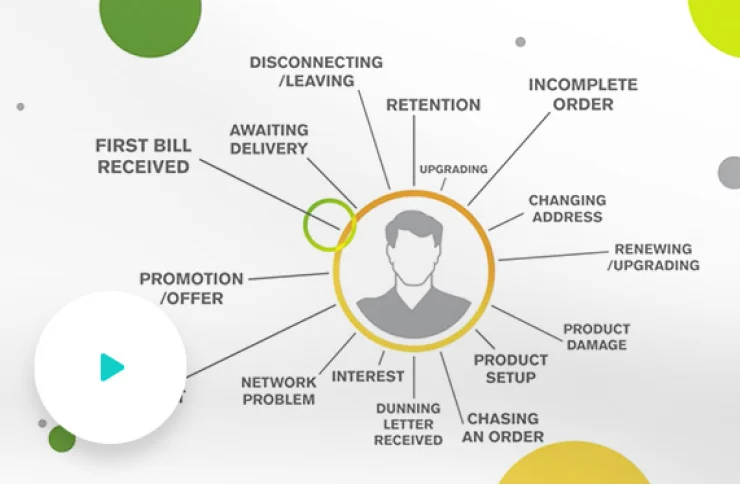
Give reps a 360 degree view of customers by combining relevant data sources
Fully control the data and analytics each person can access

Drive sales performance with analytics insights that go way beyond the capabilities of CRM
Qlik enables sales to explore and analyze CRM data. Easily combine it with other sales, marketing, and finance data to discover the channels, sales reps, customers, products, and services that perform — and those that don’t. Forecast more accurately, drive more orders, and close bigger deals.
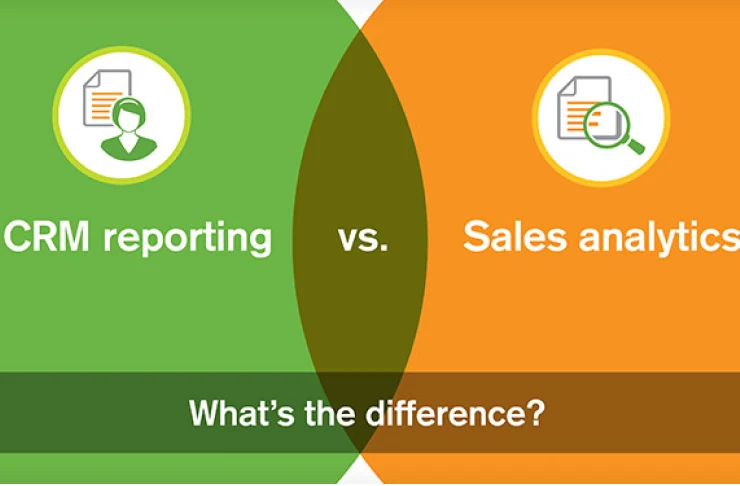
Capture more sales with data-driven insights CRM does not provide
Analyze CRM data in powerful new ways with world class analytics
Make better decisions by combining CRM and other relevant data sources
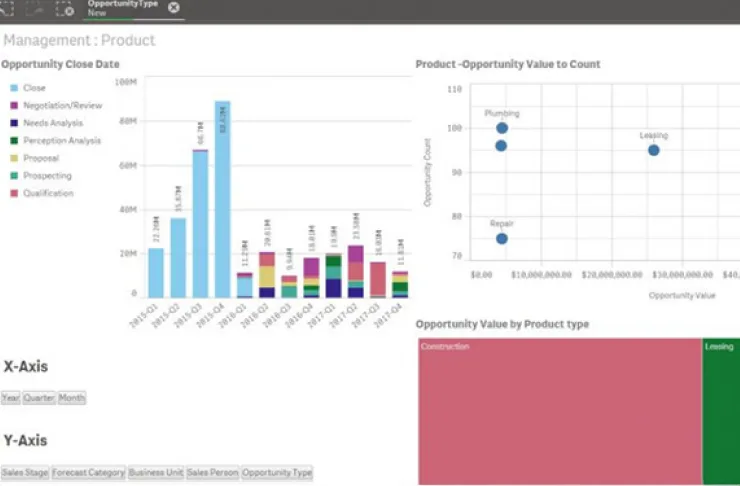
Accelerate your success with more effective product performance analysis
Build a more efficient and profitable business by maximizing the revenue opportunities your products offer. Build smarter strategies to capture cross-sell and up-sell opportunities. Make more informed, proactive decisions about critical product end-of-life, seasonality, and supply/demand trends.
Gain greater insight from consumer product sales data to drive sales improvements
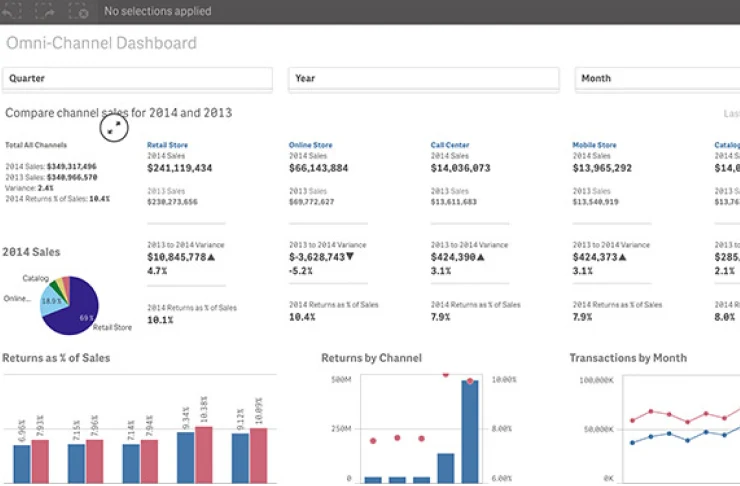
Understand and take action on omni-channel sales trends
Deepen satisfaction and loyalty by using data to deliver a great customer experience
Bring your customer data and feedback together with analytics to help proactively manage and improve the customer experience. You’ll understand what customers want, identify and prioritize actions, and measure your progress. With insight, you can constantly innovate, delight customers with a great experience, and sustain sales growth.